
How Much House Can You Actually Afford? A Realistic Formula
“How much house can I afford” is one of the most-searched questions in personal finance, and most of the answers people find are technically correct but practically misleading. They tell you the maximum a bank will approve you for — not the amount that still leaves room for savings, emergencies, and an actual life outside your mortgage payment.
Here’s the realistic version, using current 2026 numbers.
The 28/36 Rule Explained
This is the formula lenders actually use, and understanding it changes how you should think about your budget.
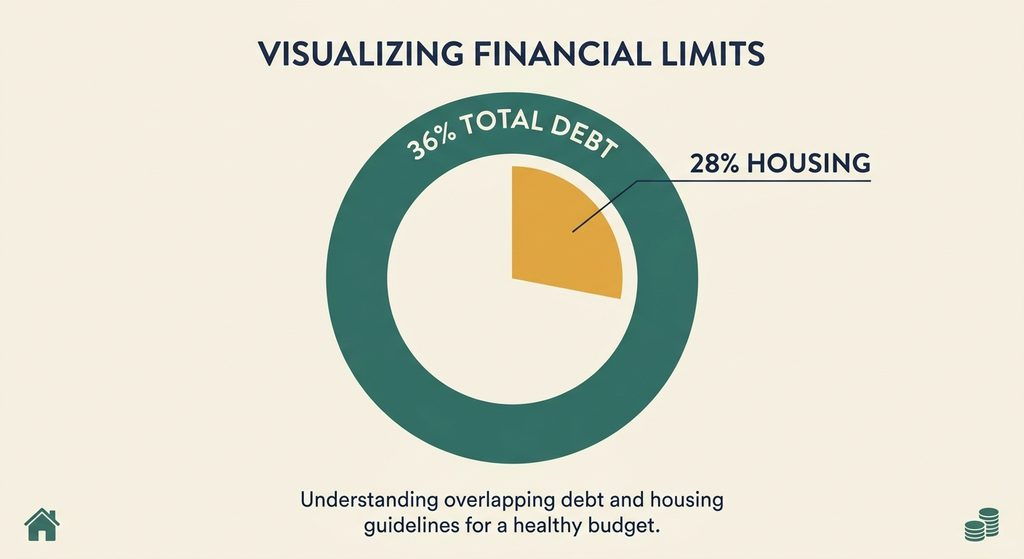
- The 28% rule (front-end ratio): your total monthly housing payment — principal, interest, property taxes, homeowner’s insurance, and HOA fees if applicable (often abbreviated PITI) — shouldn’t exceed 28% of your gross monthly income.
- The 36% rule (back-end ratio): your total monthly debt, including that housing payment plus car loans, student loans, and credit card minimums, shouldn’t exceed 36% of your gross monthly income.
A worked example: if your household earns $100,000/year, that’s about $8,333/month gross. Your max housing payment under the 28% rule is roughly $2,333/month. Your max total debt under the 36% rule is $3,000/month. If you already have $500/month in other debt payments, your actual max housing budget drops to $2,500/month.
The catch worth knowing: most lenders will approve you up to 43% back-end DTI, and FHA loans allow up to 50%. Just because you’re approved for that doesn’t mean you should borrow it — buyers who stretch to 43% DTI consistently report more financial stress than those who stay closer to 28-32%. Your credit score also plays a role in what rate you qualify for in the first place — see our full breakdown of how credit scores actually work if you’re not sure where you stand.
What This Looks Like at Different Income Levels
Using a 2026 mortgage rate of roughly 6.5-6.75% and 20% down, here’s a rough affordability range by income:
| Gross Annual Income | Approx. Max Home Price |
|---|---|
| $60,000 | ~$195,000 |
| $80,000 | ~$260,000 |
| $100,000 | ~$325,000-$440,000* |
| $120,000 | ~$390,000 |
| $150,000 | ~$487,000 |
| $200,000 | ~$650,000 |
*Estimates vary depending on down payment size, existing debt, and exact rate at the time you lock in — use this as a starting range, not a precise number.
For context on where these numbers land relative to the market: the national median home price is sitting around $400,000-$420,000 in 2026, meaning a household needs roughly $115,000 in income to comfortably afford a median-priced home with 20% down at current rates.
Front-End vs. Back-End DTI: Why Both Numbers Matter
A common mistake is only looking at the 28% housing number and ignoring the 36% total debt number. If you have significant student loan or car payments, your housing budget could be well below 28% of your income even if you technically qualify for a bigger mortgage — because your other debt is already eating into your 36% ceiling. This is exactly why two people with identical incomes can qualify for very different loan amounts.
How Much Down Payment You Actually Need
The common belief that you need 20% down to buy a house isn’t accurate for every loan type, but it does change your monthly numbers significantly. Putting down less than 20% on a conventional loan triggers Private Mortgage Insurance (PMI).
PMI explained simply: it’s insurance that protects the lender, not you, and it typically costs 0.5% to 1.5% of your loan amount per year — often adding $100-$250/month on a $300,000 loan. It’s not a dealbreaker, but it does reduce how much house you can comfortably afford at a given income, since that extra monthly cost eats into your 28% housing budget.
The trade-off: a smaller down payment gets you into a home sooner but increases your monthly payment and total interest paid. A larger down payment lowers your monthly cost and may eliminate PMI entirely, but requires more cash saved upfront. Neither is universally “right” — it depends on how much you have saved versus how much time you want to spend saving further while rents and home prices continue moving.
Hidden Costs First-Time Buyers Consistently Underestimate
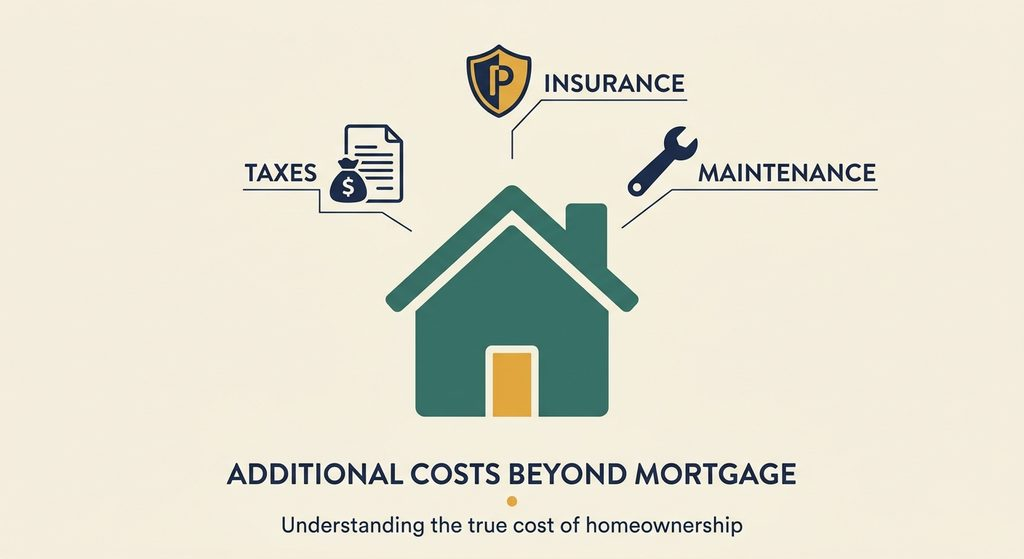
Your mortgage payment is not your actual housing cost. A more realistic rule of thumb: your true monthly housing cost typically runs 1.3-1.5x your base mortgage payment once you factor in:
- Property taxes (varies significantly by location)
- Homeowner’s insurance
- PMI, if applicable
- Ongoing maintenance and repairs (a common guideline is budgeting 1-2% of the home’s value annually)
- HOA fees, if the property has them
- Closing costs upfront (typically 2-5% of the purchase price, paid once at closing, not monthly)
This is the single biggest reason people who technically “qualify” for a home end up feeling financially squeezed after moving in — the mortgage payment alone was never the full picture.
Comfortable Payment vs. Maximum Approved: Pick a Target Range
Rather than asking “what’s the most I can borrow,” a more useful framework is picking a target based on how much breathing room you want:
- Safe: housing costs at 2.5x your annual income or less
- Comfortable: housing costs around 2.5-3x your annual income
- Stretch: approaching the 28% ceiling, minimal cushion for savings or emergencies
If you’re deciding between a “comfortable” home and a “stretch” home that a lender says you qualify for, remember that a lender’s approval reflects what you can borrow — it says nothing about your retirement contributions, emergency fund, or whether you’ll have room to handle a job change or unexpected expense a year into owning the home.
A Realistic Starting Formula
Putting it together, here’s a simple sequence to run your own numbers:
- Calculate your gross monthly income.
- Multiply by 28% to get your max comfortable housing payment (adjust downward if you carry other debt).
- Subtract your existing monthly debt payments to check against the 36% total debt ceiling — use whichever number is lower.
- Add 30-50% on top of your mortgage estimate to account for taxes, insurance, PMI, and maintenance — this gives you your realistic all-in monthly housing cost.
- Compare that number to what you’re comfortable spending, not just what a lender says you qualify for.
The Bottom Line
The formula lenders use and the formula that actually protects your financial life aren’t always the same number. Running your own realistic math — including hidden costs most calculators leave out — is the difference between buying a home you can afford on paper and buying one you can actually afford to live in.
If you’re still working out your broader monthly budget before house hunting, our post on why the 50/30/20 rule doesn’t work for millennials covers frameworks that hold up better against real housing costs. For more on this topic, see our full Home Buying coverage.
This post reflects mortgage rates and lending guidelines as of September 2026. Rates, loan limits, and PMI costs change regularly — verify current numbers with a lender before making purchase decisions.