
Renting vs. Buying: The Real Math Nobody Shows You
“Renting is throwing money away” is one of the most repeated pieces of financial advice out there, and in 2026, it’s simply not accurate for a huge number of people. The real math is more nuanced — and more location-dependent — than either side of this debate usually admits.
Here’s the actual framework, using current numbers.
The Price-to-Rent Ratio: The Fastest Gut Check
Before running detailed spreadsheets, there’s a quick formula that tells you a lot: the price-to-rent ratio, calculated as a home’s purchase price divided by its annual rent for a comparable property.
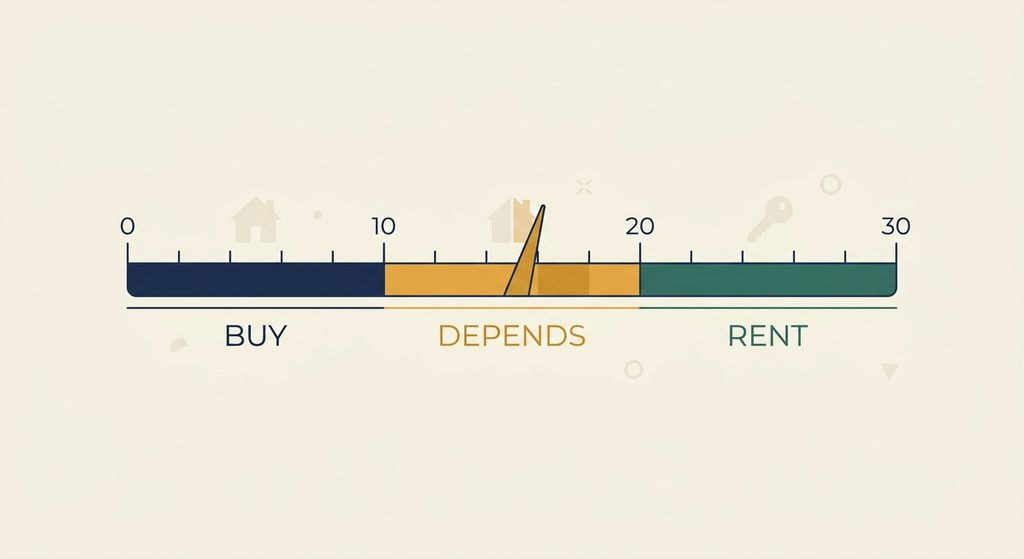
- Below 15: buying tends to win
- 15-20: it depends on your personal situation and how long you plan to stay
- Above 20: renting tends to be the mathematically better move, especially for shorter timelines
In 2026, the national price-to-rent ratio is sitting well above its long-run average — meaning that, nationally, the math currently tilts toward renting for people who won’t stay put for many years. But this number varies enormously by city: in more affordable markets like Cleveland, buying can break even in as little as 4 years, while in expensive coastal markets like San Francisco, the breakeven horizon can stretch past a decade.
The Breakeven Point: The Number That Actually Matters
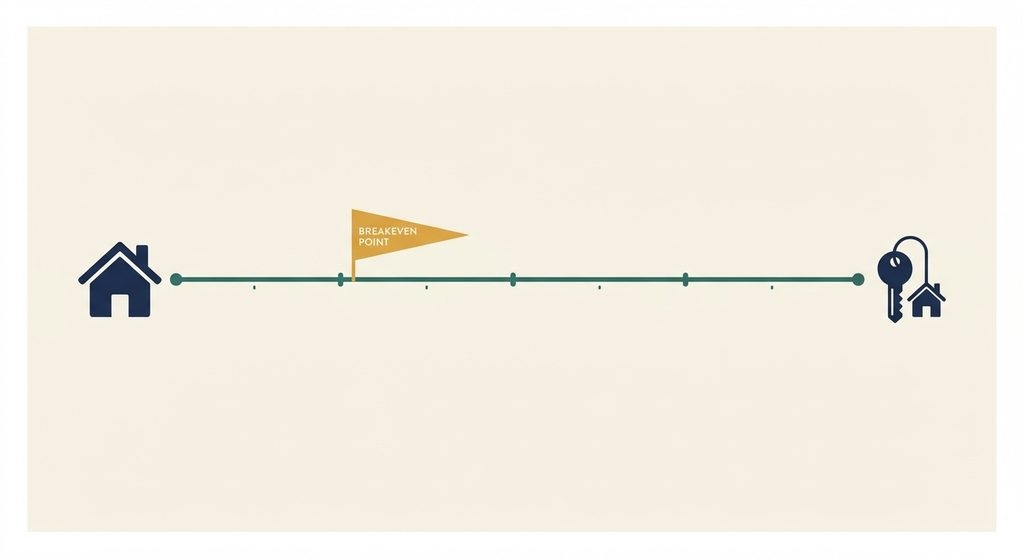
The breakeven point is the number of years you’d need to own a home before your total cost of ownership drops below what you would have spent renting an equivalent property over that same period — accounting for equity built, appreciation, and the money you didn’t spend on rent.
Current estimates vary depending on the source and local market, but most 2026 analyses put the typical breakeven point somewhere between 5 and 10 years at today’s mortgage rates, compared to the shorter 5-7 year norm that held in lower-rate environments. In high-cost coastal metros, that horizon can stretch to 10-14 years. In affordable Midwest and Sun Belt markets, it can be as short as 3-4 years.
The practical test: if you’re confident you’ll stay in the home for at least 7 years, buying is the better default in most markets. If you might move within 3-5 years, renting usually wins once you account for transaction costs.
The Opportunity Cost of Your Down Payment
This is the part most rent-vs-buy conversations skip entirely. When you put $40,000 toward a down payment, that money isn’t just “spent” — it’s also money that could have been invested elsewhere. A full comparison has to account for what that down payment could have earned if invested instead of tied up in home equity.
This doesn’t mean buying is a bad move — real estate can still build wealth through leverage and appreciation — but it does mean the “renting is throwing money away” argument is incomplete. Renting “throws away” your monthly payment; buying “ties up” your down payment and ongoing maintenance costs instead. Neither is free.
The True Cost of Renting vs. Owning
Comparing a rent payment directly to a mortgage payment is a common mistake, since a mortgage payment is rarely the full cost of owning.
Renting’s real costs: monthly rent, renter’s insurance (typically inexpensive), and the near-total absence of maintenance responsibility.
Owning’s real costs: the mortgage payment, property taxes, homeowner’s insurance, PMI if applicable, ongoing maintenance and repairs, and closing costs upfront (typically 2-5% of the purchase price) plus selling costs later (commissions and fees that can consume another 5-6% of the sale price when you eventually move).
A useful rule of thumb: your true monthly cost of ownership often runs 40-70% higher than the mortgage payment alone once these are factored in. Skipping this step is exactly how people end up “qualifying” for a home on paper but feeling financially squeezed once they’re actually living in it.
Where Buying Tends to Win in 2026
Buying tends to come out ahead when:
- You plan to stay in the home 7+ years
- Your local price-to-rent ratio is under 15-16
- You have a stable income and a comfortable down payment (reducing or eliminating PMI)
- You’re in a market with steady appreciation and moderate rent growth
Where Renting Tends to Win in 2026
Renting tends to come out ahead when:
- You’re likely to move within 3-5 years (transaction costs on buying and selling eat up short-term gains fast)
- Your local price-to-rent ratio is above 20-25
- You’d rather invest the difference between renting and owning elsewhere (retirement accounts, other investments) instead of tying it up in a down payment
- You’re in a high-cost coastal market where the gap between renting and owning monthly costs is currently wide
A Simple Way to Run Your Own Numbers
- Find your local price-to-rent ratio — divide a comparable home’s price by its annual rent.
- Estimate your realistic timeline — how many years are you actually likely to stay?
- Compare that timeline to your market’s typical breakeven point — shorter markets favor renting, longer ones favor buying.
- Factor in the true cost of ownership, not just the mortgage payment — add 40-70% for taxes, insurance, maintenance, and PMI.
- Account for the opportunity cost of your down payment — what else could that money be doing if it weren’t tied up in home equity?
The Bottom Line
Neither renting nor buying is universally the “smarter” financial move in 2026 — it depends heavily on your local price-to-rent ratio, how long you plan to stay, and what the true (not headline) cost of ownership looks like in your specific market. The oversimplified “renting is throwing money away” advice ignores opportunity cost, transaction costs, and the fact that a mortgage payment is never the full story. Run your own numbers before assuming either path is automatically correct for your situation.
If you’re still working out your monthly budget before deciding, see why the 50/30/20 rule doesn’t work for millennials for frameworks that hold up better against real housing costs. And if buying is on the table, check out how much house you can actually afford for the full breakdown.
This post reflects rent and mortgage market data as of September 2026. Local price-to-rent ratios and breakeven timelines vary significantly by city — check current local data before making a decision.